Data mining and data visualization
Data mining is the process of finding correlations among several fields of large relational databases. Through this process, data is analyzed from different perspectives and summarized into useful information. This information will then be used to adopt the necessary strategies to solve a problem.
MATLAB has several tools that allow us to perform a data mining analysis. In particular, the Statistics and Machine Learning Toolbox presents many techniques that give us the opportunity to obtain useful information from data. Good examples of these tools are:
- Statistical plotting with interactive graphics
- Descriptive statistics for large datasets
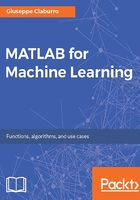
An example of visualizing multivariate data is shown in the following figure:

For example, we can start our analysis from visual exploration of data through a statistical plotting with interactive graphics. In this regard, MATLAB has many graphs and charts ready for use. In addition, the Statistics and Machine Learning Toolbox augments MATLAB plot types with probability plots, box plots, histograms, scatter histograms, 3D histograms, control charts, and quantile-quantile plots. For multivariate analysis, dendrograms, biplots, parallel coordinate charts, and Andrews plots are included in the toolbox.
In some cases, we must visualize multivariate data. Many statistical analyses require only two variables: A predictor variable (independent variable) and a response variable (dependent variable). The relationships between the two types of variables is easy to visualize using 2D scatter plots, bivariate histograms, boxplots, and so on. Similarly it is possible to extend the analysis to trivariate data and display it with 3D scatter plots, or 2D scatter plots with a third variable encoded. However, many datasets involve a larger number of variables, making direct visualization more difficult. In MATLAB, it's possible to visualize multivariate data using various statistical plots, through the Statistics and Machine Learning Toolbox (Figure 1.16).
Finally we can extract useful information using a descriptive statistic. A descriptive statistic identifies a set of techniques and tools aimed at fulfilling one of the top priorities of the statistic: describe, represent, and summarize the observed data to analyze a certain phenomenon. The Statistics and Machine Learning Toolbox includes functions for calculating:
- Measures of central tendency, including average, median, and various means
- Measures of dispersion, including range, variance, standard deviation, and mean or median absolute deviation
- Linear and rank correlation
- Results based on data with missing values
- Percentile and quartile estimates
- Density estimates using a kernel-smoothing function